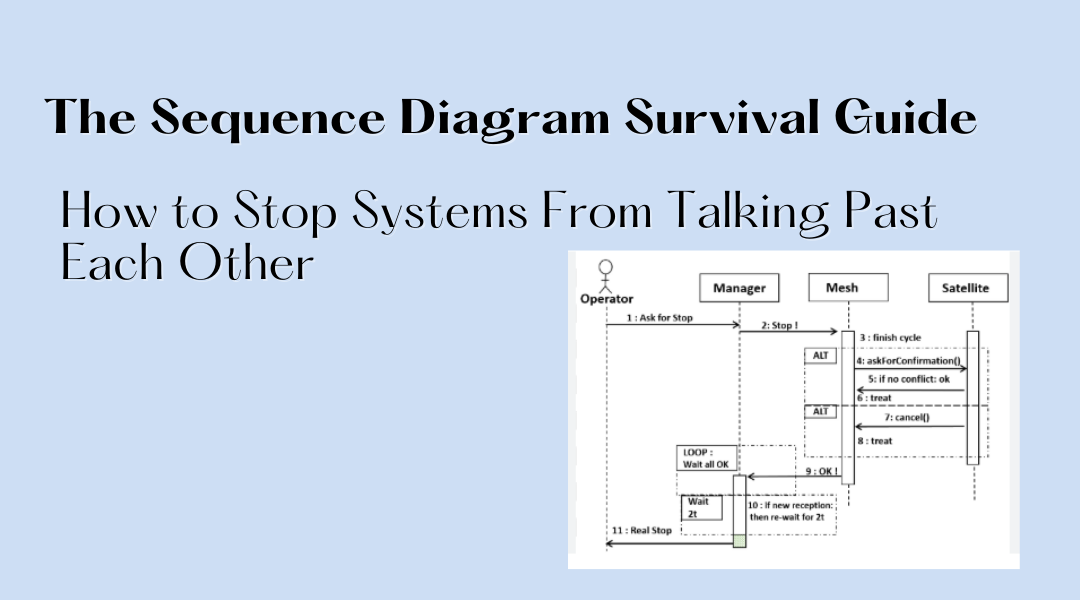
Picture this: It’s 3 AM on launch night. Your team’s new ride-sharing feature keeps timing out, but nobody can figure out why. The mobile team swears they’re sending requests. The backend team insists they’re responding. The payment gateway logs show… nothing. Everyone’s pointing fingers when you grab a whiteboard marker and start drawing boxes and arrows. Fifteen minutes later, the problem becomes painfully obvious – the authentication service was silently swallowing requests during peak load.
This is why I keep sequence diagrams in my troubleshooting toolkit. They’re not just UML formalities – they’re battle-tested tools for cutting through system chaos. Here’s how to use them like a seasoned engineer.
When You’re Fighting These Fires:
1. The “It Works on My Machine” Standoff
That classic moment when QA finds a bug that devs can’t reproduce. Last month, our team wasted days arguing about a shopping cart bug until we mapped the sequence:
- Browser → Adds item (HTTP POST)
- API → “Success!” (200 OK)
- But… the database commit failed silently
The diagram made the race condition undeniable
2. The Integration Black Hole
When external systems start misbehaving, sequence diagrams become your flashlight. We once had a hotel booking system that would:
- Reserve rooms successfully
- Take payment
- Then mysteriously cancel bookings
The culprit? A legacy system interpreting our confirmation as a cancellation after 30 seconds of silence.
3. The Performance Mystery
Why is the app slow? Instead of guessing, diagram the critical path:
- User clicks → UI disables button
- API call → Load balancer → Service A → Service B
- Service B waits for cache refresh
Ah-ha! That cache TTL is murdering response times during spikes.
Pro Tips From the Trenches:
1. Start with the happy path, then break it
- Draw how it should work first. Then layer in:
• Timeouts
• Error states
• Retry logic
• Race conditions
2. Use real timing data
- “Service responds in 50-300ms” tells a very different story than “responds quickly”
3. Color code your pain points
- Red arrows for known bottlenecks
- Blue for external dependencies
- Green for happy path
4. Include the human elements
- That “manager approval” step that takes 3 days? Put it in the diagram.
Real-World War Stories:
The Case of the Vanishing Inventory
An e-commerce client kept overselling limited edition sneakers. Our sequence diagram exposed:
- 100 users check stock simultaneously (shows 10 pairs left)
- All get “in stock” status
- 50 check out successfully
- System finally updates inventory… after orders complete
The Fix: Move inventory reservation before payment authorization
The Phantom Notification Bug
A banking app showed successful transfers that never happened. Turns out:
- App sent “success” after API accepted request
- But before transaction actually cleared
- Network timeout made the app assume success
The Aftermath: $250k in overdraft fees refunded
When to Reach for Other Tools:
- For data structures → Class diagrams
- For overall system layout → Component diagrams
- For business processes → Flowcharts
- When management asks for “something simple” → Pray
The Bottom Line:
Next time you’re:
• In a meeting where everyone’s describing different systems
• Debugging an issue that “shouldn’t be possible”
• Designing a new integration
Grab the nearest writing surface and start drawing those boxes and arrows. The time you spend diagramming will save you days of debugging. Because in complex systems, what’s obvious on paper is often invisible in code.
Remember: Good systems communicate clearly. Great systems have engineers who can map that communication when things go wrong. And things always go wrong.
